Bitcoin Hits Resistance as BTC Bulls Face a Major Test
Bitcoin is cooling off after climbing into a key resistance zone that will determine if the recent rally has true staying power.
 BTCcoinbeat.news
BTC/USD live chart
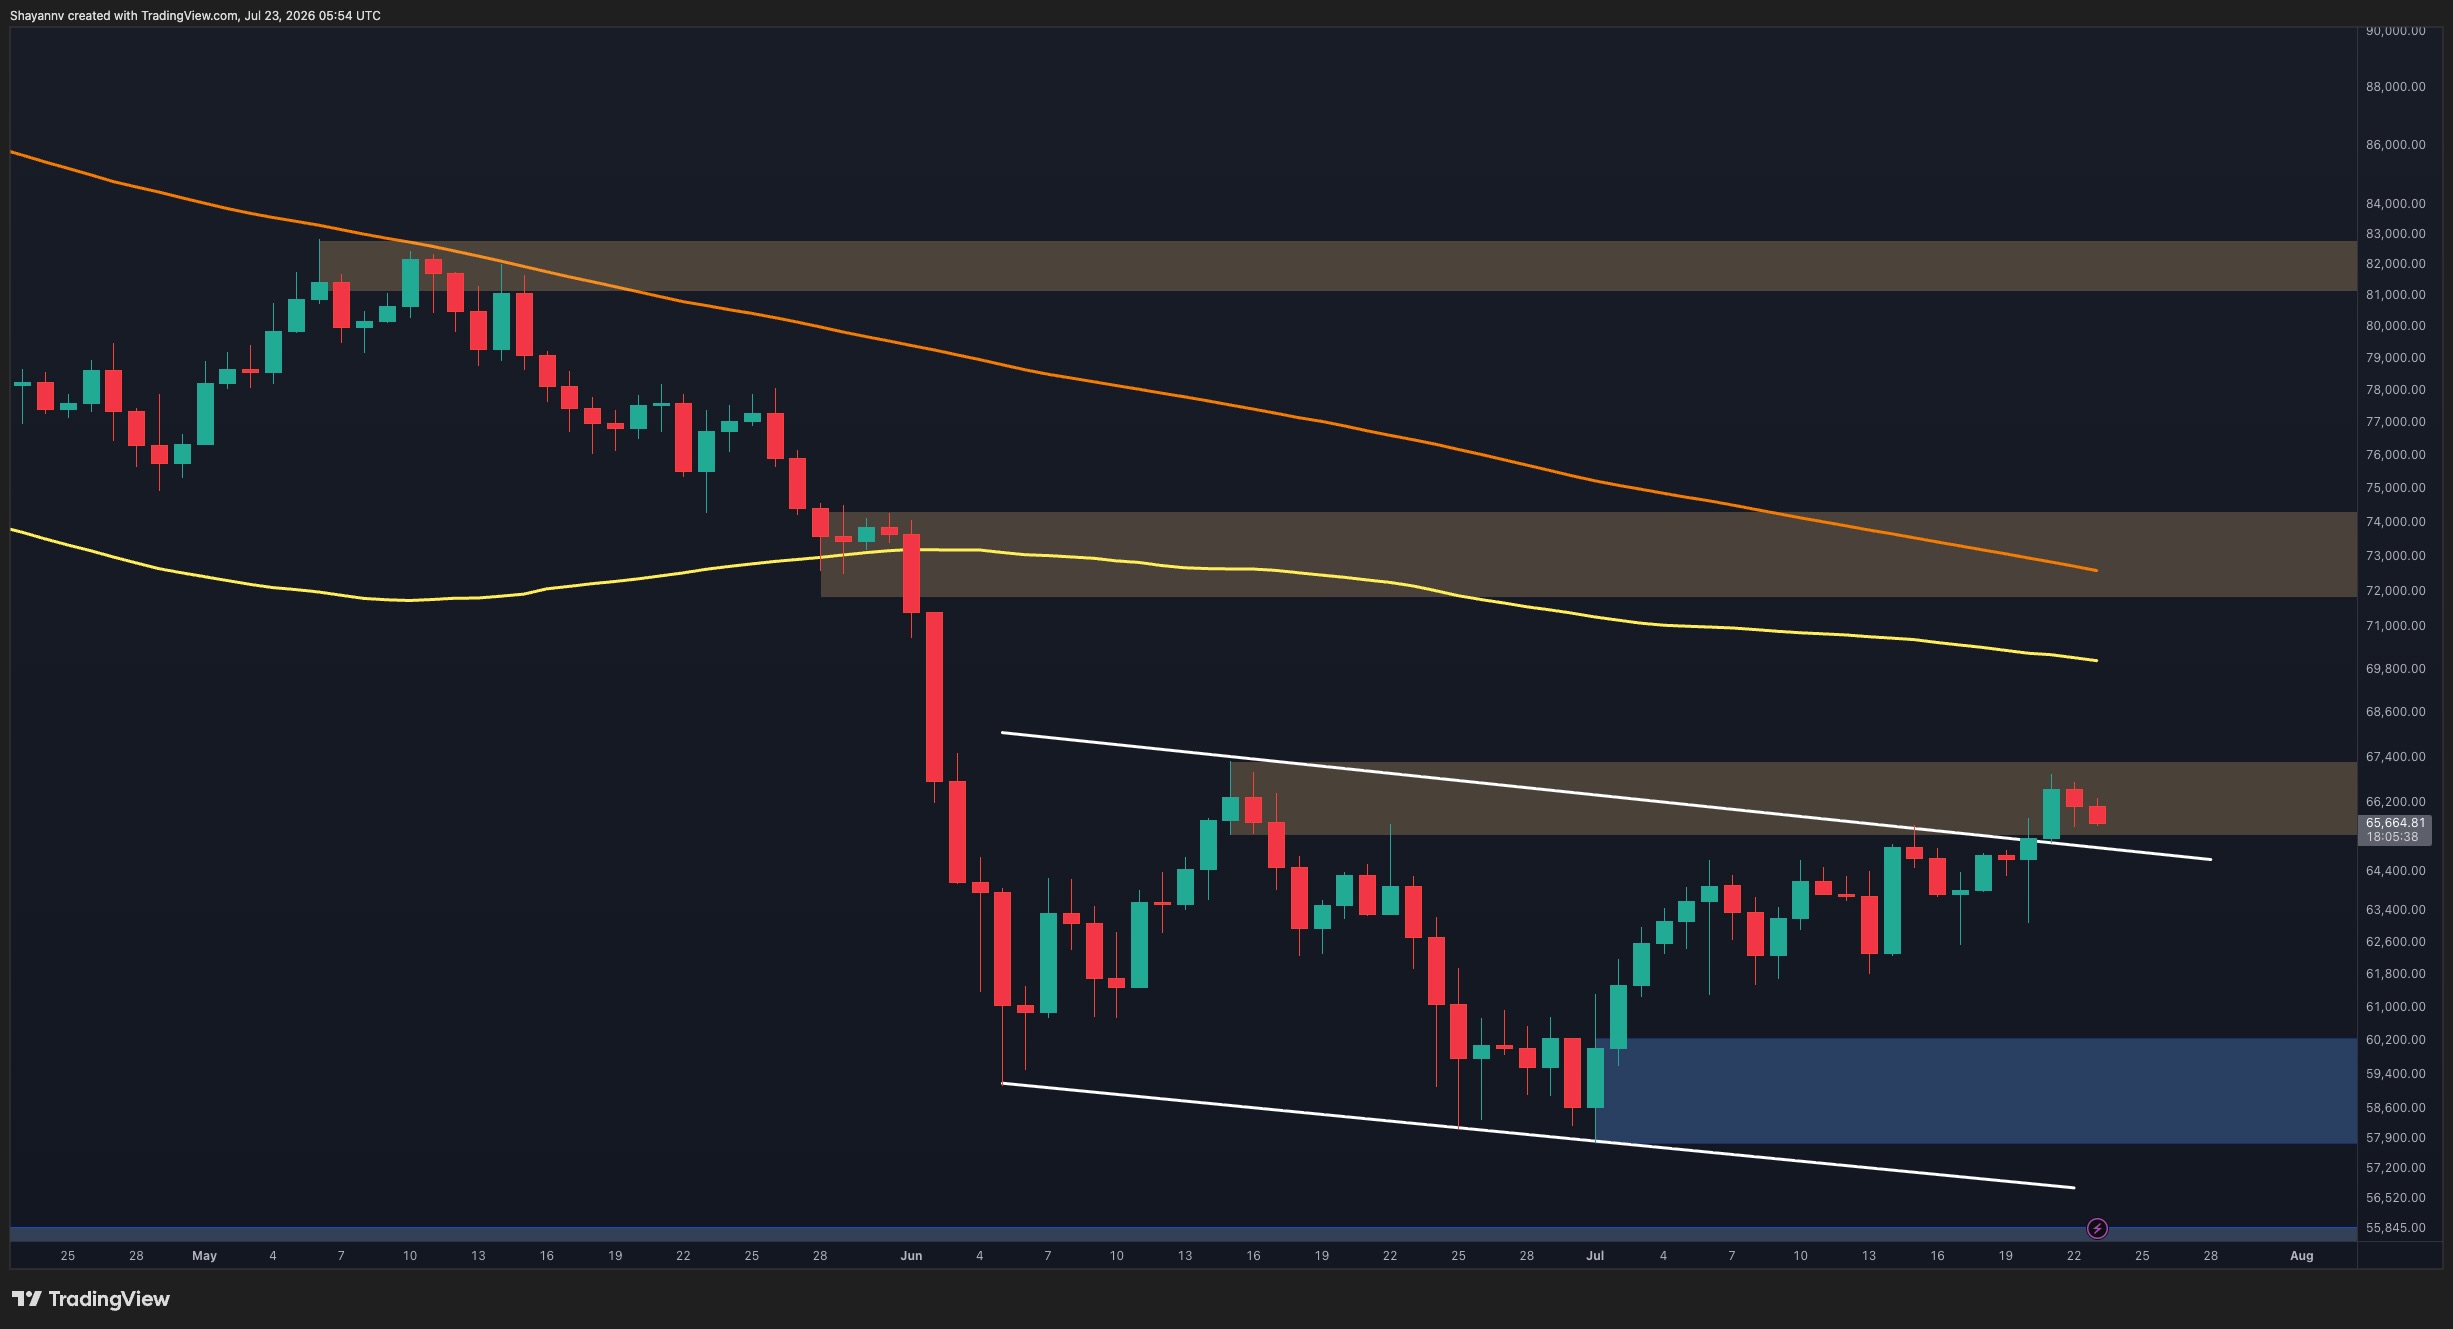
LIVEBitcoin has reached a critical supply zone between 65,500 and 66,700 dollars. This area has acted as a roadblock for sellers in the past, and current price action suggests traders are now pausing to see if the momentum can hold. While the asset successfully broke above a long standing descending trendline, it still faces pressure from the 100 day and 200 day moving averages on the daily chart.
Market participants are now watching the 63,000 to 64,000 dollar range closely. This zone now functions as a primary support level. If the price stays above this area, the short term bullish outlook remains intact. However, a drop below this support would likely drag Bitcoin back toward the 58,000 to 59,500 dollar range, where the recent buying began.
The 4 hour chart shows that the market is consolidating beneath overhead resistance. This pause looks like standard profit taking rather than a total trend reversal. If buyers can push the price decisively above 66,700 dollars, it could open the door for a move toward 72,000 dollars and higher. For now, the sentiment remains cautious until Bitcoin can clear the larger liquidity pools located further up the chart.
Traders should pay attention to how the market reacts to this resistance level in the coming sessions. Large pockets of short side liquidity sit near the 88,000 dollar mark, which remains a long term target for many. Until the price can sustain a position above the major overhead resistance levels, the current recovery is still considered a corrective move within a wider price cycle.
Prices update live from CoinMarketCap. Market data, not financial advice.
Market sentiment
Be the first to react
▍Comments (0)
No comments yet. Start the conversation!