Bitcoin Price Analysis: BTC Needs This Key Breakout for Recovery
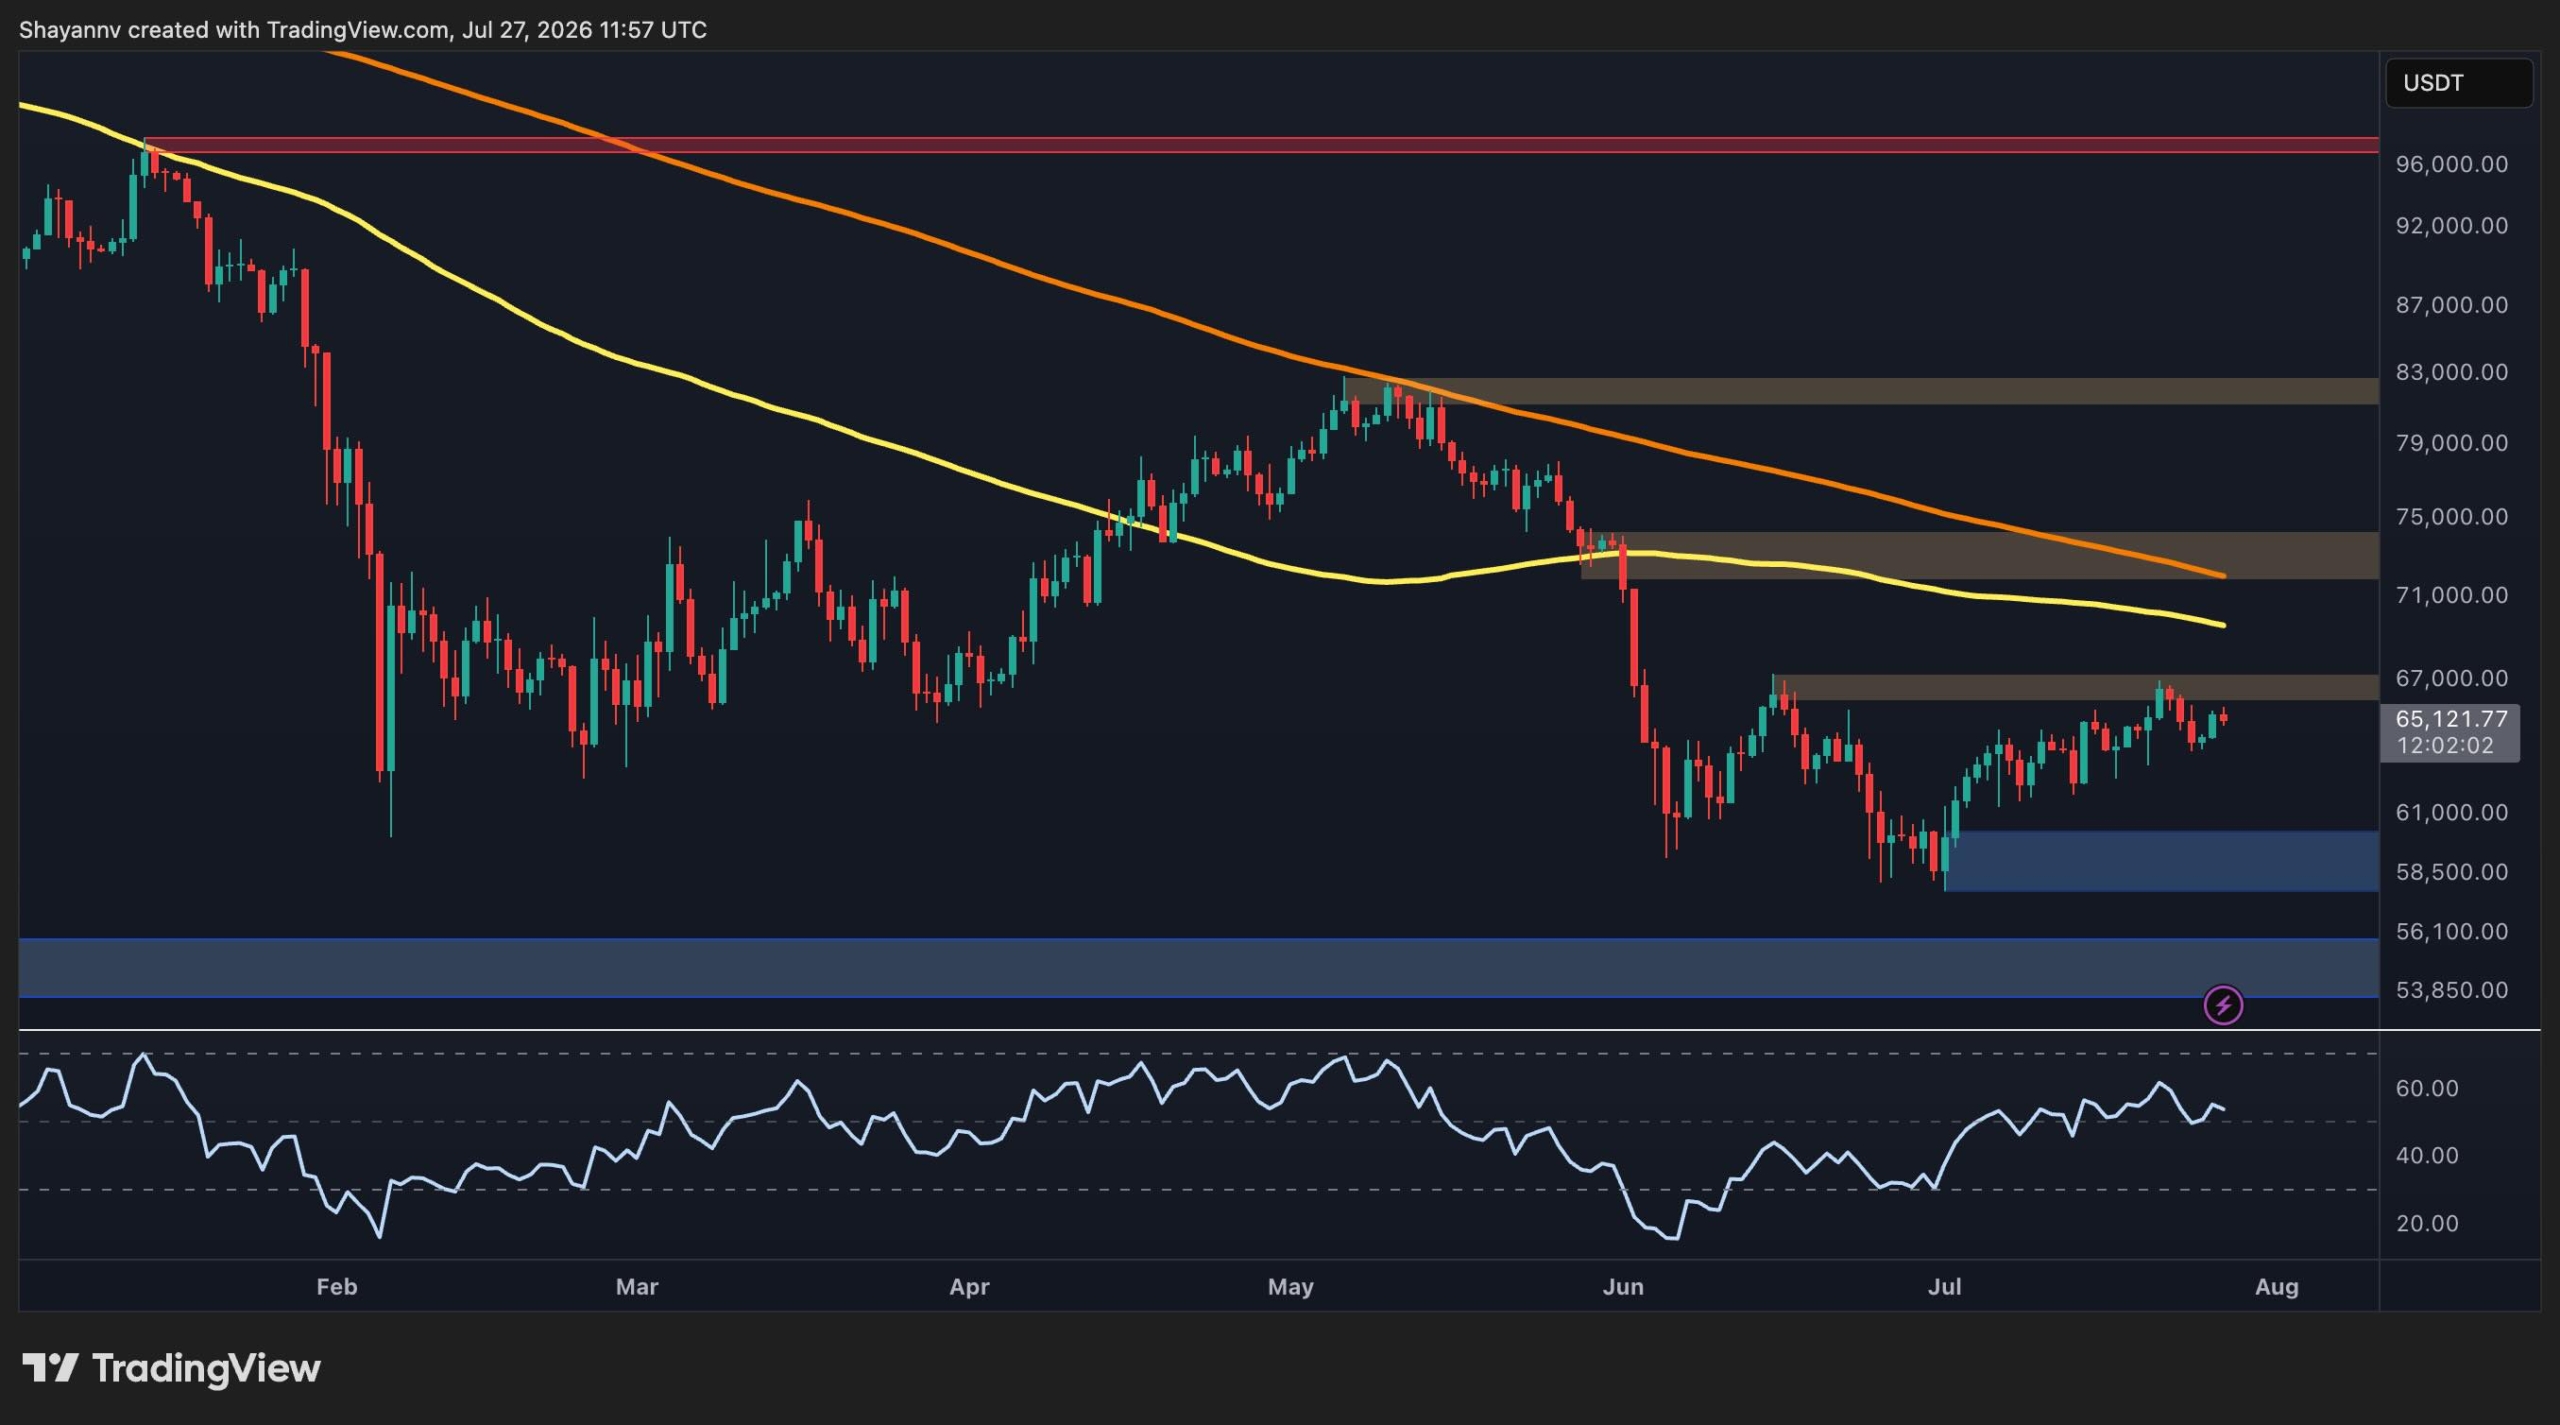
Bitcoin is showing signs of stabilization near $65,000, but traders should watch key resistance levels before confirming a true trend reversal.
 BTCcoinbeat.news
BTC/USD live chart
LIVEBitcoin has found some stability after sliding from its mid $80,000 highs. While the price is creating higher lows on smaller timeframes, it still struggles to reclaim critical moving averages on the daily chart. Currently trading near $65,000, the asset must push past $67,000 to overcome immediate resistance and target the $72,000 range.
The 4 hour chart tells a more cautious story. Bitcoin recently broke below an ascending trendline, which shifted short term momentum toward sellers. Price is now trapped in a consolidation zone between $65,000 and $66,000. If Bitcoin fails to hold the $63,500 support level, it could slide back down to test the major $60,000 demand zone.
On chain data offers a glimpse of hope through the Adjusted Spent Output Profit Ratio. This indicator has been below 1.0 for months, showing that holders have been realizing losses. The metric is finally crawling back toward the neutral line, which suggests that intense selling pressure is starting to fade. If this indicator holds above 1.0, it could signal a healthier recovery.
For now, the market remains in a wait and see mode. Investors are looking for a decisive break above the $67,000 supply zone to confirm that buyers have reclaimed control. Until then, Bitcoin remains vulnerable to further retracements if sellers remain active at these overhead resistance levels.
Prices update live from CoinMarketCap. Market data, not financial advice.
Market sentiment
Be the first to react
▍Comments (0)
No comments yet. Start the conversation!