Bitcoin Price Chart Hints at a Quiet Move Toward $76,000
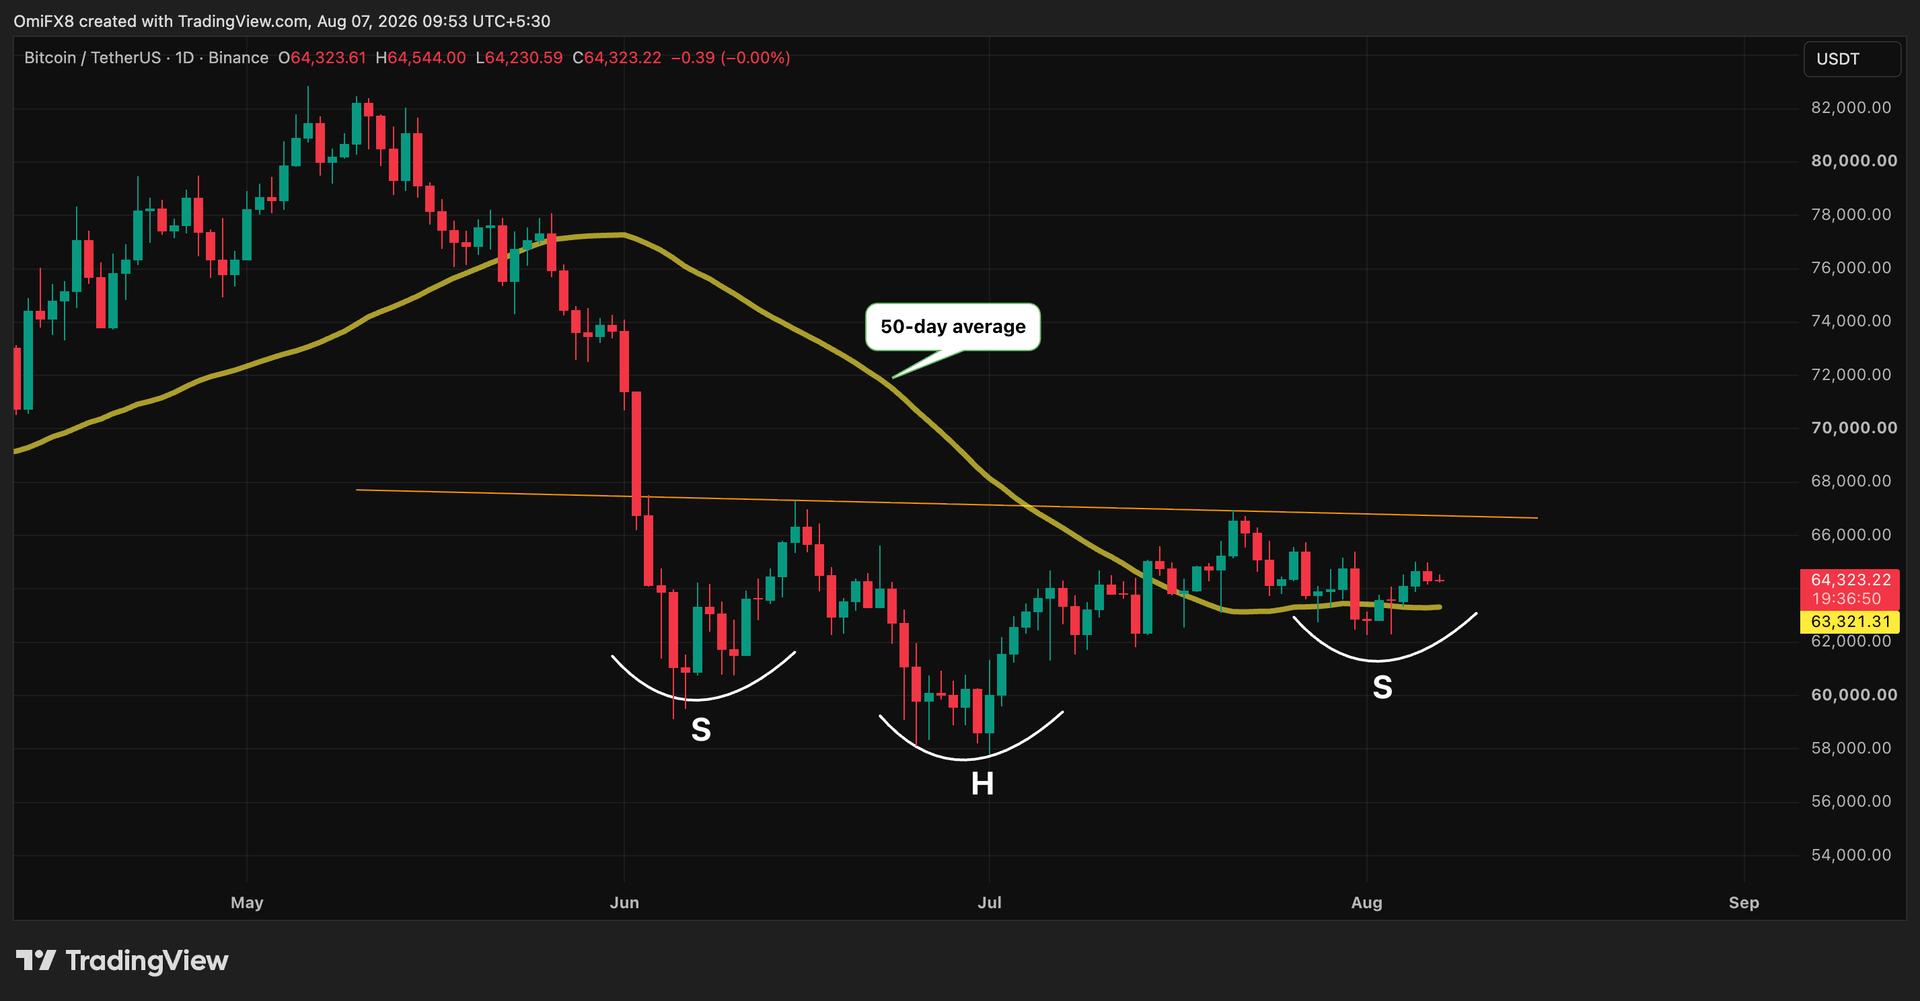
Bitcoin is trading sideways, but technical charts are building up a pattern that could push the top coin toward $76,000. Read the latest.
 BTCcoinbeat.news
BTC/USD live chart
LIVEBitcoin might look a bit boring on your screen today, but chart watchers are spotting a setup that often comes before a big price swing. Beneath the quiet price action, technical indicators are slowly forming a bullish pattern. Traders love these setups because they usually catch the market by surprise.
However, this pattern is not confirmed just yet. One major price level stands in the way, and it will decide whether this bullish setup actually plays out or falls flat. Markets hate certainty, so waiting for a confirmed breakout is the smart play before making any big moves.
Keep your eyes on the charts over the next few days to see if buyers can step in and break that crucial resistance level. If they do, the path toward $76,000 opens right up. If they fail, expect the choppy sideways action to stick around a little longer.
Prices update live from CoinMarketCap. Market data, not financial advice.
Market sentiment
Be the first to react
▍Comments (0)
No comments yet. Start the conversation!