Bitcoin Price Stalls at $63K as $60K Support Faces Test
Bitcoin is struggling to break past resistance, leaving traders to wonder if the $60,000 support level can hold.
 BTCcoinbeat.news
BTC/USD live chart
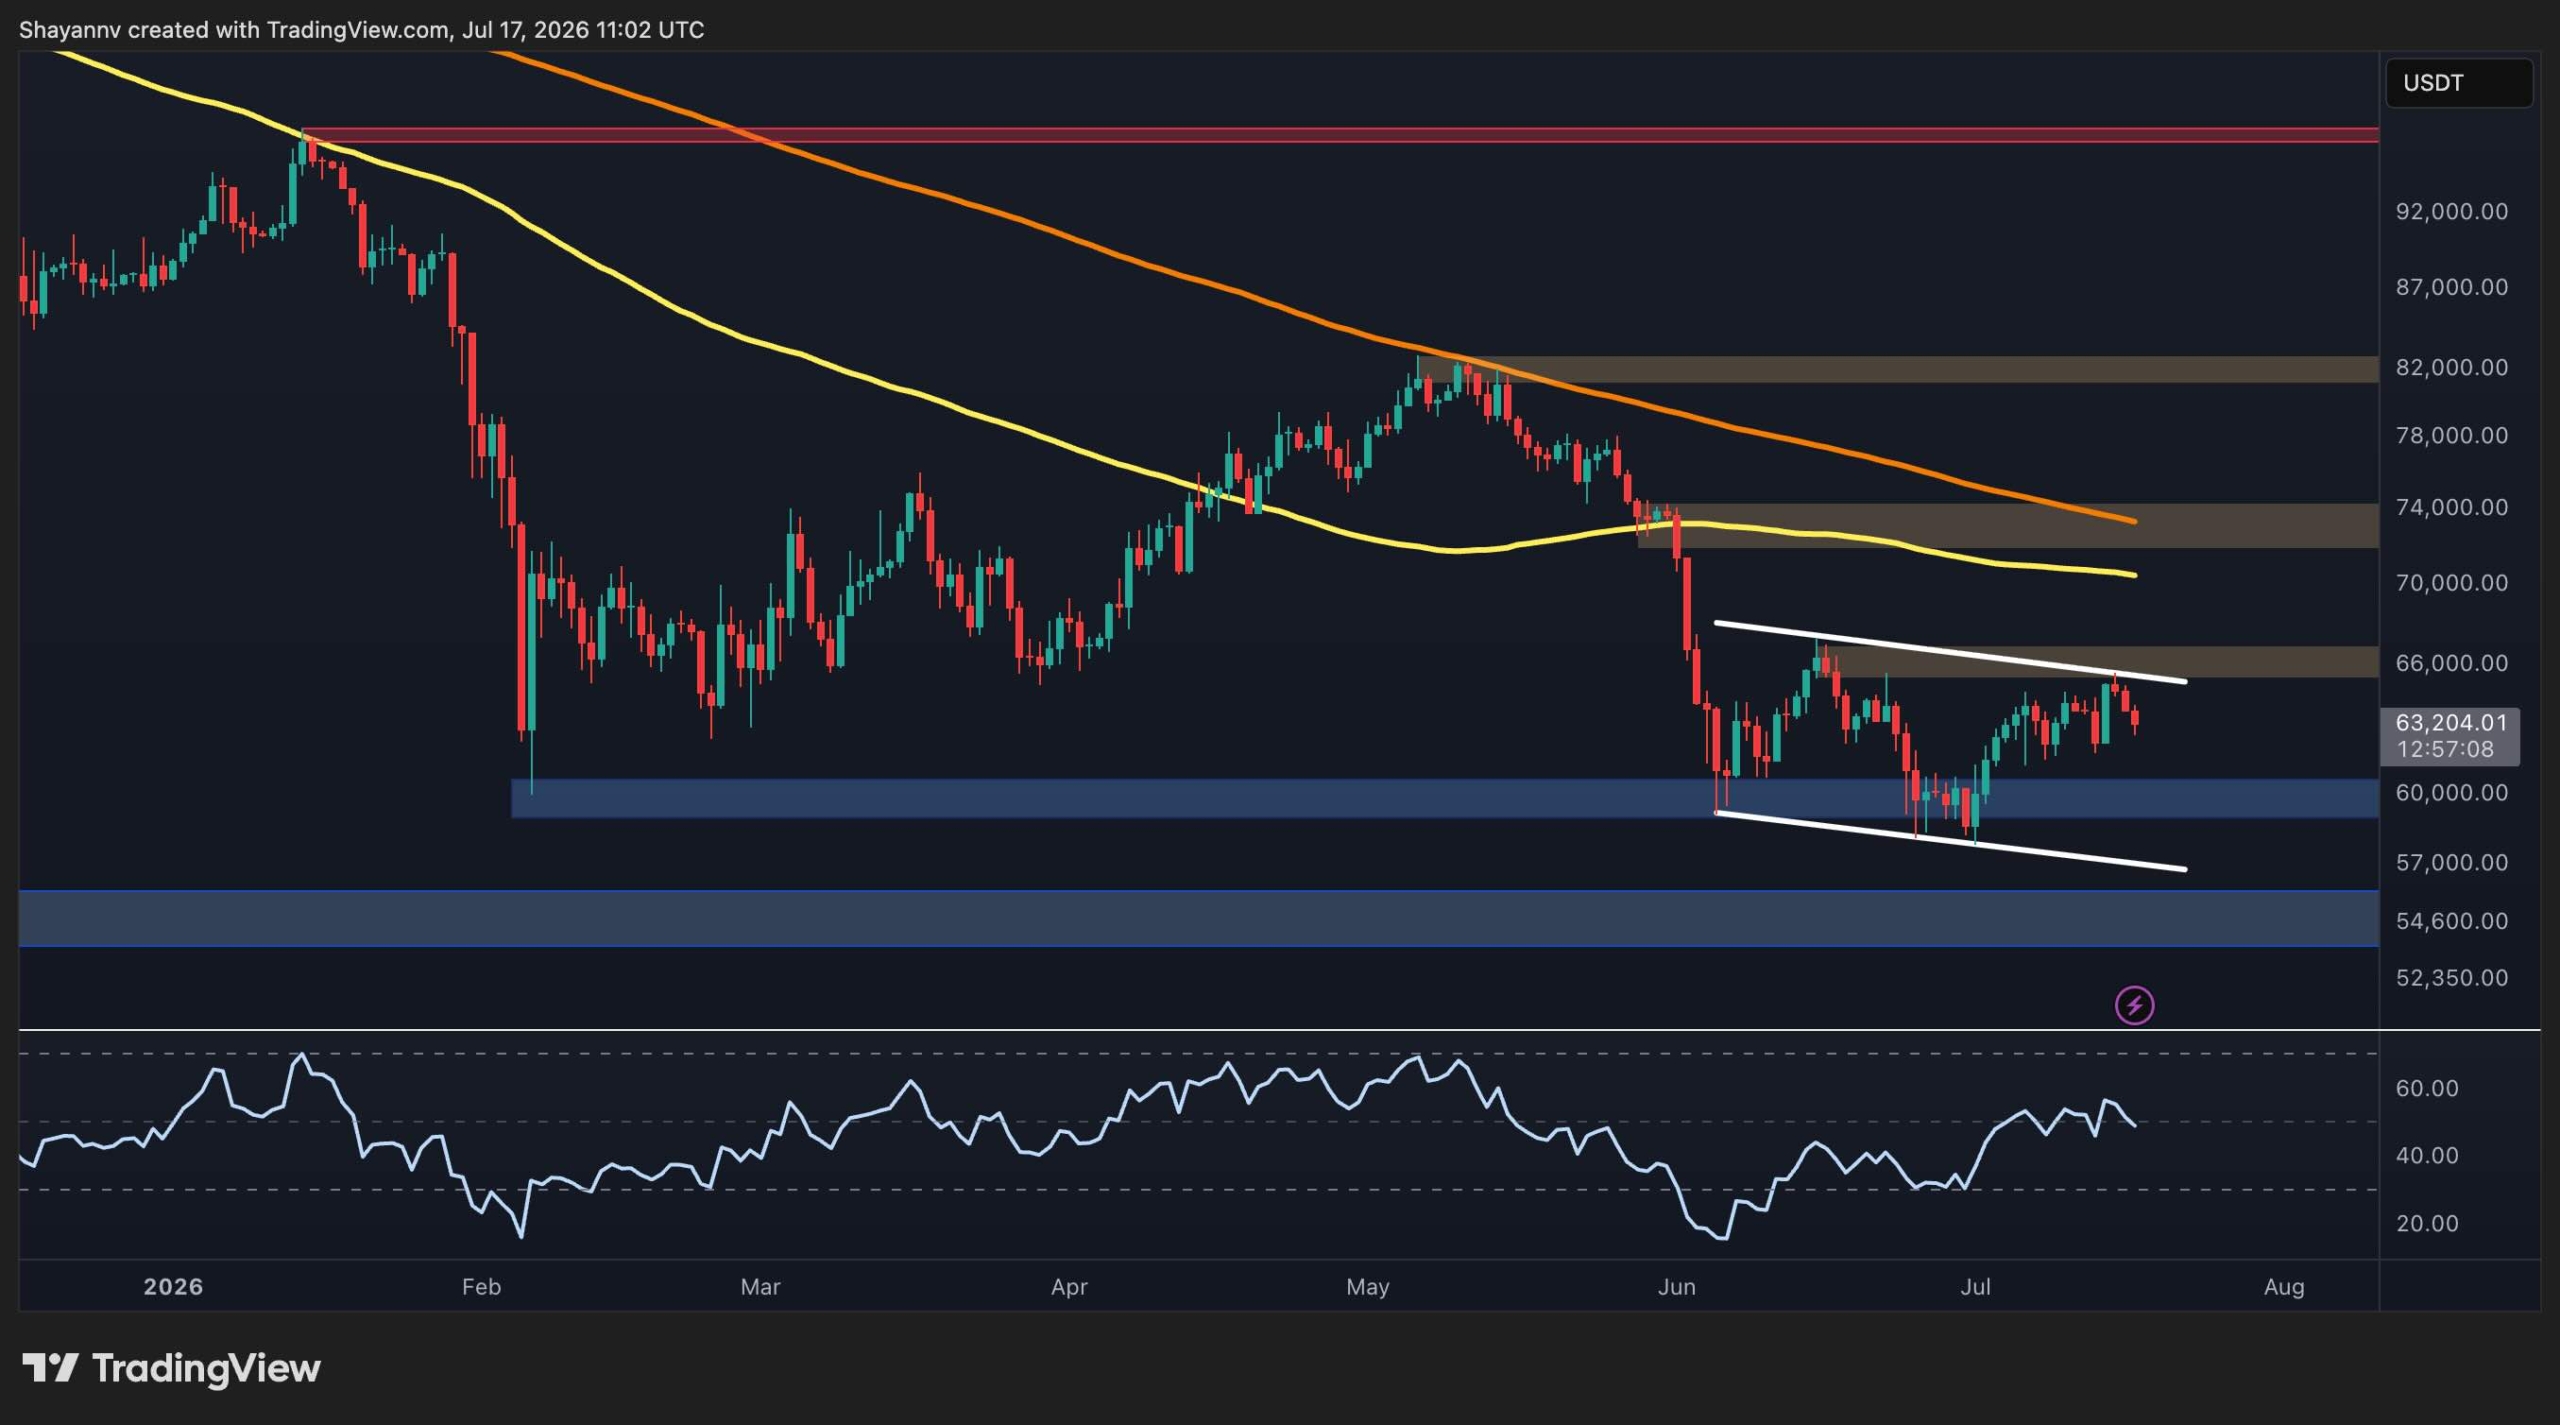
LIVEBitcoin is currently trading near $63,000 as it continues to navigate a corrective phase. After failing to reclaim the $66,000 resistance level, the price remains stuck below both the 100 day and 200 day moving averages. These technical indicators are trending downward, which keeps the pressure on the bulls to defend the market from further losses.
On the 4 hour chart, Bitcoin is caught in a descending channel. While the price has managed to hold above $61,000, market indecision is high as the Relative Strength Index hovers around the neutral 50 level. A clean breakout above $66,000 is necessary to signal any real recovery, but for now, the path of least resistance appears to be toward the downside.
Data from the Spent Output Profit Ratio also reflects a cautious mood. Long term holders are now moving coins at a loss, which often signals that experienced investors are capitulating during this correction. While this can sometimes indicate that a bottom is forming, it also means there is significant selling pressure still looming over the market.
Investors should watch the $60,000 mark closely. If this support fails to hold, the next target for the price sits near $55,000. Until Bitcoin can prove it has the strength to break above its current technical resistance, the market remains vulnerable to further volatility.
Prices update live from CoinMarketCap. Market data, not financial advice.
Market sentiment
Be the first to react
▍Comments (0)
No comments yet. Start the conversation!